Why Your Cleaning Business Isn't Profitable (3 Numbers)
Discover the 3 hidden profit killers in your cleaning business: jobs running long, gap time, overtime creep — track your efficiency number to protect margins.
Chris Wilson
If you're running a cleaning business with employees, you've probably had this moment: revenue looks solid, the schedule is full, but somehow the bank account doesn't match the hustle.
The problem isn't that you're bad at business. The problem is you're managing profit with the wrong instruments.
Most cleaning business owners track revenue and payroll, then hope the difference works out. But profit doesn't live in hope—it lives in three specific measurements that most operators never see until it's too late.
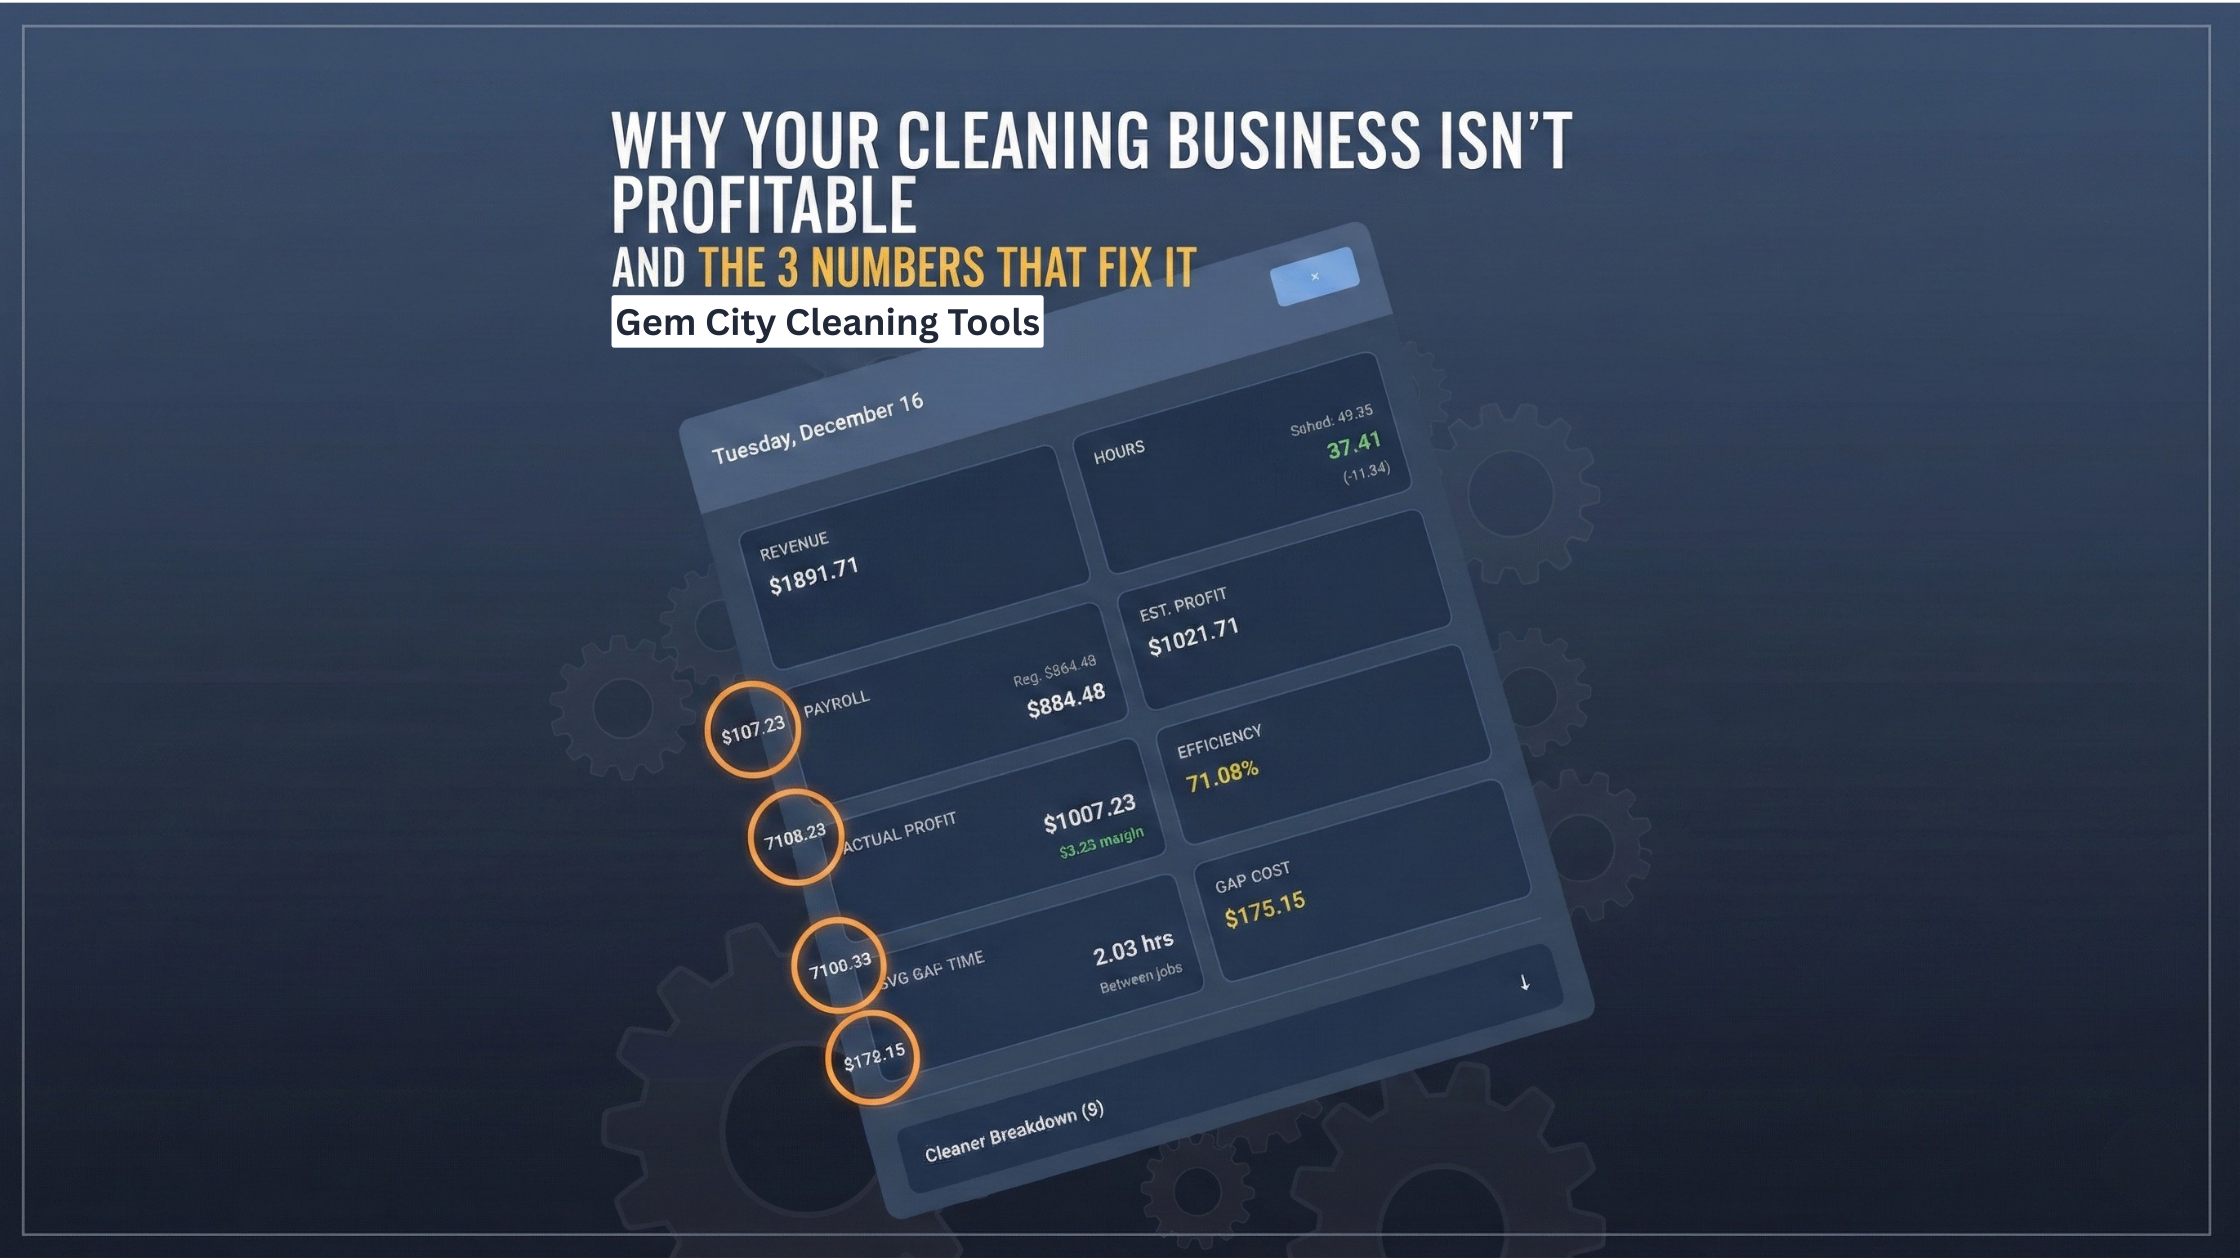
This is the breakdown of how Week Stats and Date Stats give you instant visibility into whether this week was a win, and exactly where the losses happened if it wasn't.
For Busy Owners:
- Week Stats answer: "Did we make money this week?" (revenue, labor hours, profit margins, efficiency)
- Date Stats answer: "Which day killed our margins and why?" (daily breakdown with cleaner performance and gap time analysis)
- Estimated Profit forecasts margins based on your schedule and pricing
- Actual Profit shows what really happened once timeclock data comes in
- Efficiency diagnoses whether teams are slow, jobs are mispriced, or conditions were rougher than expected
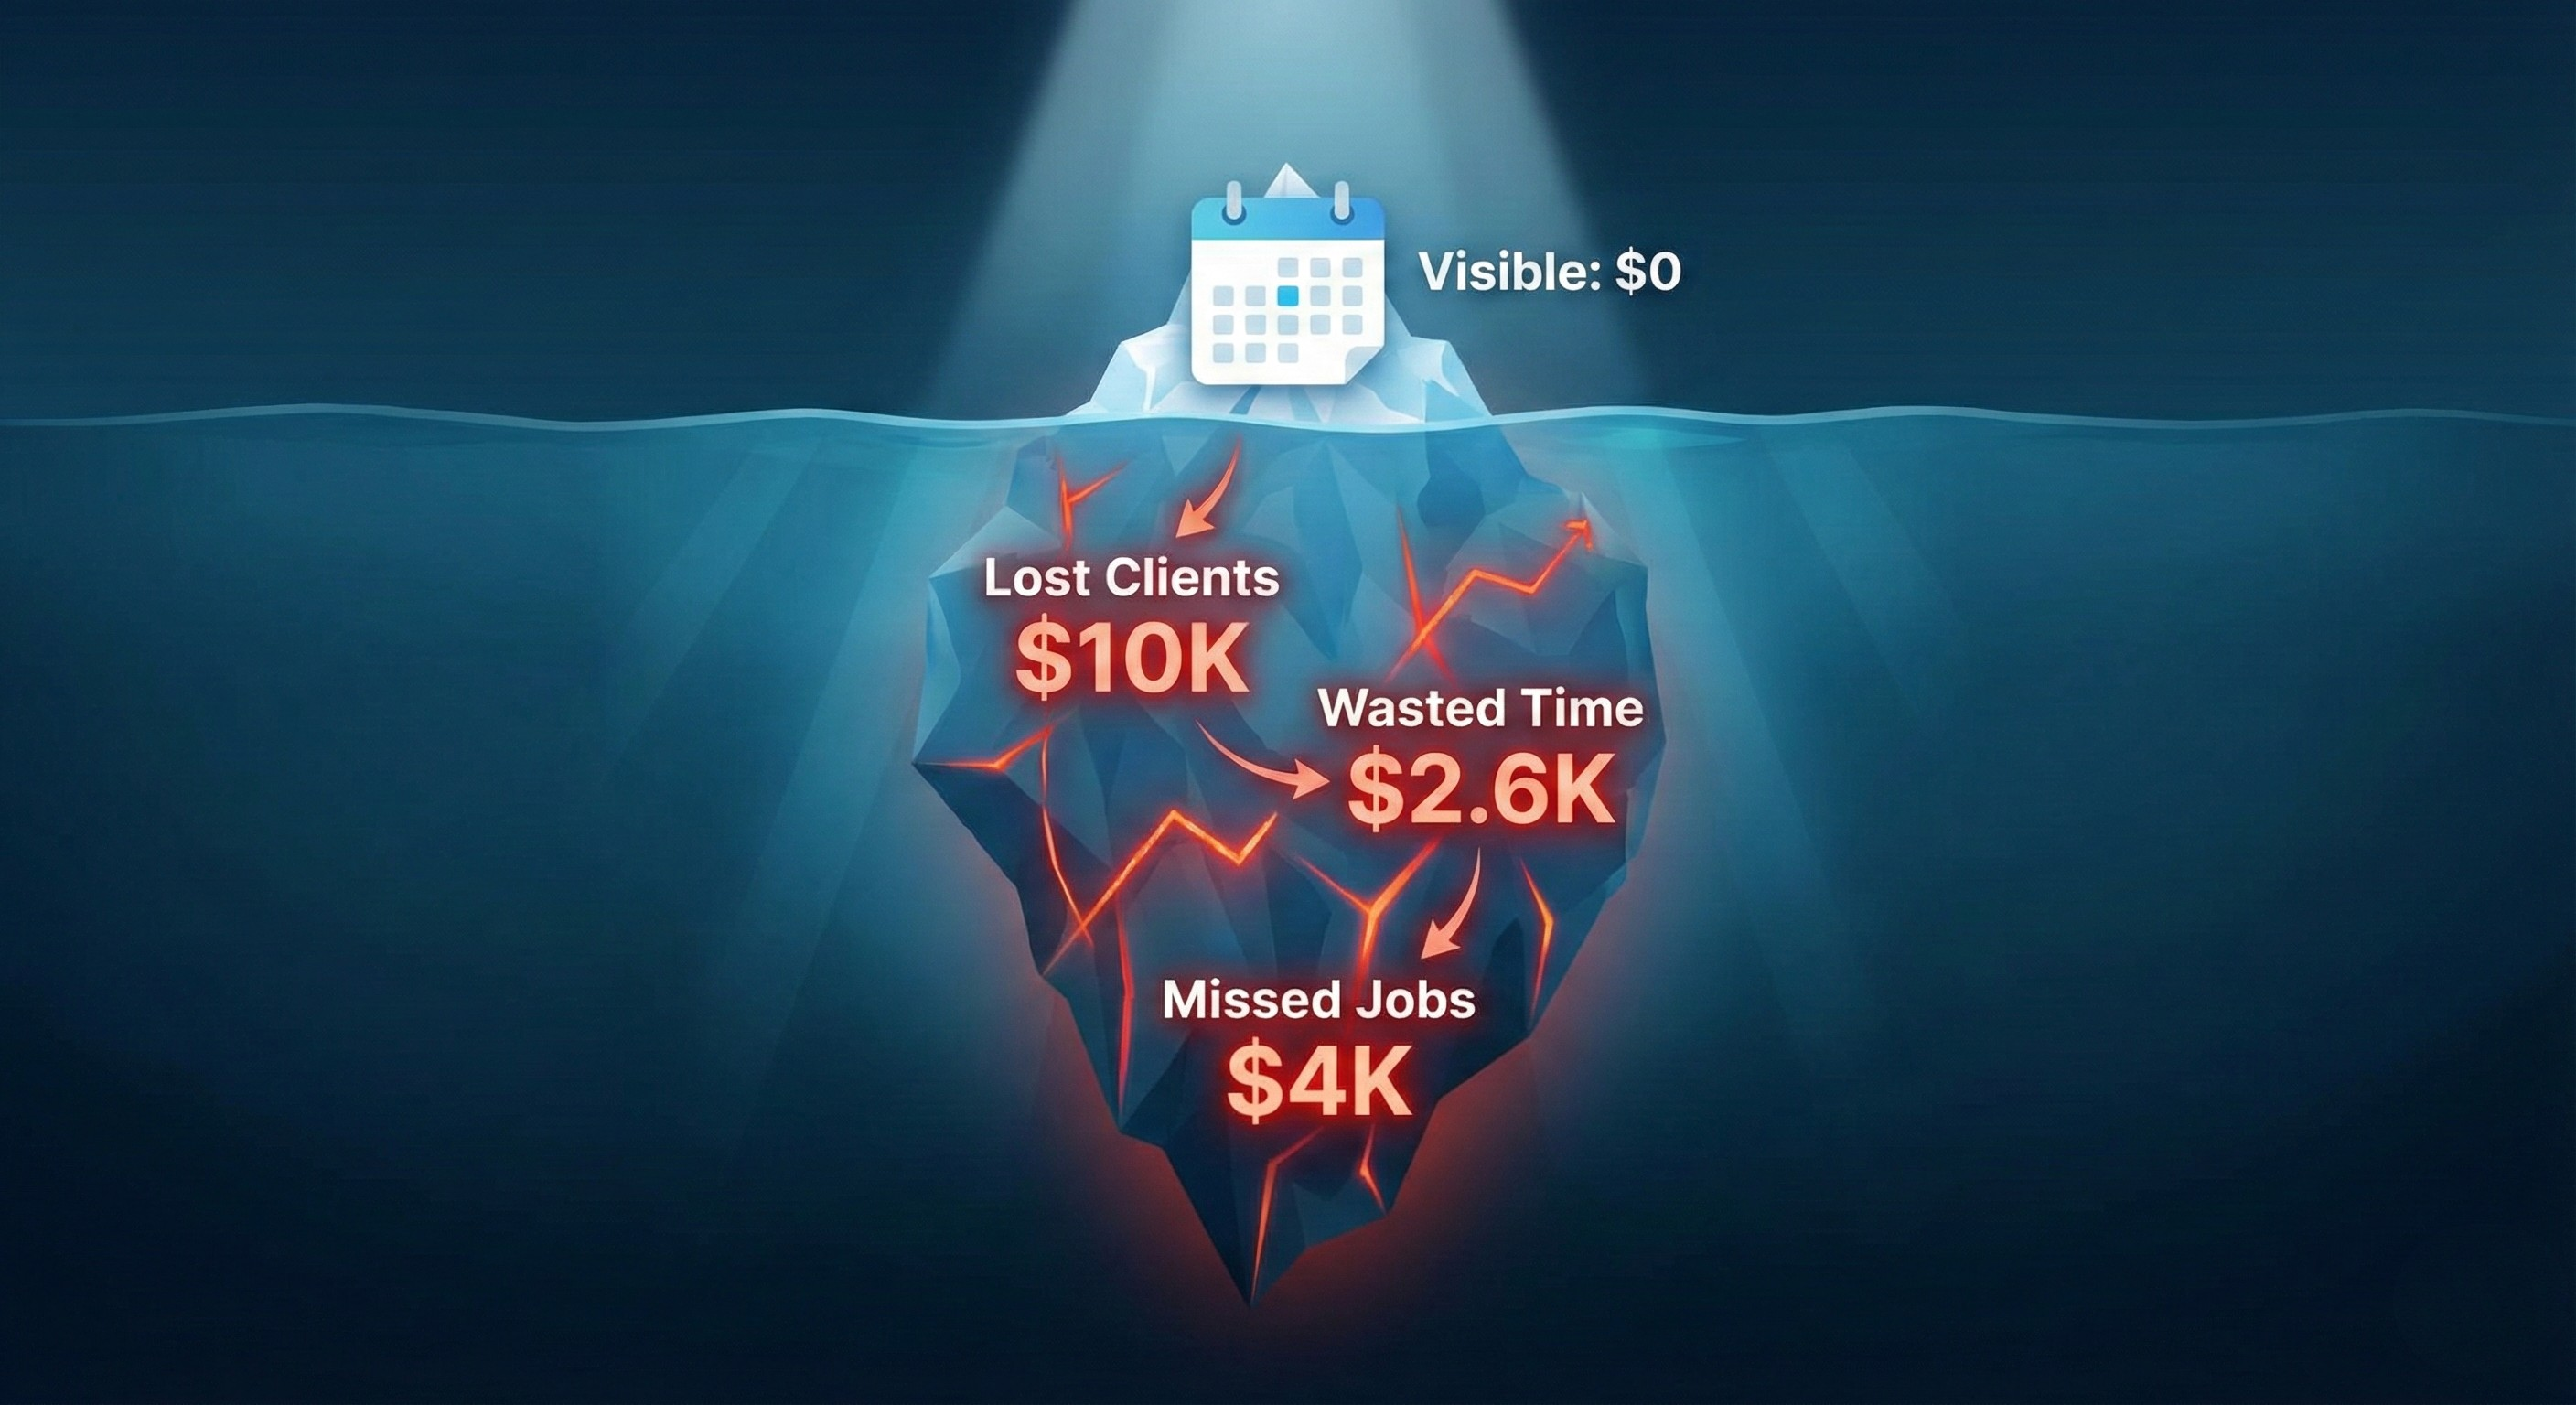
- Gap Time reveals the hidden payroll cost between jobs that silently destroys margins
The 3 Profit Killers Hiding In Your Schedule
Before we get into the solution, here's what's actually draining your margins:
1. Jobs That Run Long (The Estimation Problem)
You price a job at $250 expecting 3 labor hours. Your team takes 4.5 hours. You just gave away an hour and a half of payroll for free.
2. Gap Time (The Invisible Payroll Leak)
Your cleaners finish at 2:00 PM and don't start the next job until 3:30 PM. You paid for 90 minutes of drive time and waiting. The client paid for zero minutes of it.
3. Overtime Creep (The Compounding Cost)
Small overruns all week add up to 42 hours on one employee instead of 40. That last 2 hours costs you time-and-a-half, turning a profitable week into a break-even week.
Here's the frustrating part: you can't fix what you can't see. If you're tracking this stuff in spreadsheets or trying to reconstruct it from memory, you're already two weeks behind the problem.
Manual Tracking vs Real-Time Profit Visibility
| What You Need To Know | Manual Tracking | Automated Stats |
|---|---|---|
| Did this week make money? | Wait for payroll to process, compare to invoices | One glance at Week Stats |
| Which day hurt margins? | Export timeclock data, cross-reference schedule | Tap any day for instant breakdown |
| Why did Tuesday run over? | Ask cleaners, check notes, guess | See actual vs estimated hours by job and cleaner |
| How much did gap time cost? | Almost impossible to calculate manually | Displayed automatically with cost breakdown |
| Which cleaners trigger overtime? | Discover during payroll (too late) | Monitor weekly totals in real-time |
The difference isn't just convenience. It's the difference between reacting to last week's damage and preventing next week's losses.
Start With The Week: Your Profit Scoreboard
The Week Stats Popover functions like a financial dashboard for your operation. Check it the same way you'd check your bank balance—not because something's wrong, but because you need to know where you stand.
Here's what you see instantly:
- Total Revenue: What the schedule produced in billable work
- Estimated Hours: What the plan said the work should require
- Actual Hours: What your team actually logged (when timeclock data exists)
- Total Payroll: What you paid out, including overtime premiums
- Estimated vs Actual Profit: The gap between plan and reality
- Efficiency Percentage: How close reality came to the estimate
- Job Counts: Total scheduled, completed, pending, and cancelled
The Goal: Glance at your week and know whether you're trending positive before you're staring at the P&L two weeks later wondering what happened.
Understanding Estimated vs Actual Profit
Most cleaning business owners live in "estimated world" until payroll hits and something doesn't add up. Here's the clean distinction:
Estimated Profit (Planning Reality)
This is your forecast. If you price a job at $250 and estimate 3 labor hours at $18/hour, your estimated profit is $196. This number tells you whether the plan makes sense.
Actual Profit (Operational Reality)
This is what happened. When timeclock data comes in and shows your team took 4 hours instead of 3, and one of them hit overtime rates, your actual profit drops to $145.
When estimated profit is strong but actual profit is weak, you're looking at a pattern that needs fixing—not bad luck.
Efficiency: The Fastest Diagnostic In Your Business
Efficiency is your shortcut to answering: "Are we moving slower, or was the job genuinely bigger than expected?"
Here's how to read it:
- 100% efficiency: You hit the estimate exactly
- Below 100%: Work took longer than planned (margins compressed)
- Above 100%: Team beat the estimate (tight routing, good pairing, ideal conditions)
Critical Context: Efficiency isn't a performance review. It's a diagnostic tool. Sometimes a 75% efficiency day is completely justified (deep clean, move-out, first-time reset). The value is in identifying patterns, not punishing individuals.
Drill Into The Day: Where The Week Got Won Or Lost
Once you know the week was good or bad, the Date Stats Popover explains why.
In one view, you see:
- Daily revenue totals
- Scheduled vs actual labor hours
- Payroll breakdown (regular hours plus overtime)
- Estimated vs actual profit
- Efficiency percentage
- Gap time analysis (average gap and total cost)
- Cleaner-by-cleaner breakdown (hours worked, wages paid, overtime status, and drive segments)
If the week is a movie, the day view is the scene-by-scene breakdown that shows you exactly where the plot went sideways.
A Real Example: Strong Week With One Problem Day
Here's a typical week for a small cleaning operation:
| Day | Revenue | Est. Hours | Actual Hours | Efficiency | Gap Time |
|---|---|---|---|---|---|
| Monday | $1,250 | 22.0 | 21.0 | 105% | 0.6 hrs |
| Tuesday | $1,180 | 20.0 | 25.5 | 78% | 2.4 hrs |
| Wednesday | $1,320 | 23.0 | 22.2 | 104% | 0.7 hrs |
| Thursday | $1,410 | 24.0 | 24.0 | 100% | 0.9 hrs |
| Friday | $1,090 | 18.5 | 19.0 | 97% | 0.5 hrs |
| Week Total | $6,250 | 107.5 | 111.7 | 96% | 5.1 hrs |
From the week view, this looks fine. $6,250 in revenue is respectable.
But the day view tells a different story: Tuesday destroyed the week's margins.
Now the right questions become obvious:
- Did one job run significantly over estimate?
- Was there a team pairing issue (experience mismatch, training gap)?
- Did routing create excessive drive time?
- Did overtime kick in because of Tuesday's overrun?
This is how you move from "I think we had a rough week" to "here's exactly what happened and what we're adjusting."
Diagnosing Low-Efficiency Days Without Guessing
When efficiency drops, the day breakdown becomes your checklist for identifying root causes.
Scenario 1: Team Performance Issue
Common indicators:
- Actual hours consistently higher across multiple jobs
- Same cleaner(s) appear on multiple low-efficiency days
- Pattern repeats across different job types
Action steps:
- Review checklists and clarify expectations
- Verify equipment and supplies are accessible (missing tools cost hidden minutes)
- Consider team pairing adjustments for complex jobs
- Provide targeted training on efficiency bottlenecks
Scenario 2: Mispriced Job
Common indicators:
- One job dominates the day's hour overrun
- Team performs efficiently on other days
- Customer or property type doesn't match estimate assumptions
Action steps:
- Update estimate for this customer or property type
- Add pricing adjustments for square footage, condition, pets, or reset level
- Document job-specific factors for future estimates
Scenario 3: Challenging Conditions
Common indicators:
- One-off day that doesn't repeat in subsequent weeks
- Significant "extra work" context (move-out, first clean, deep reset, neglected property)
- Team efficiency is otherwise consistent
Action steps:
- Tag job types appropriately for apples-to-apples comparison
- Implement premium pricing for first-time cleans or condition-based add-ons
- Build buffer time into estimates for high-variability job types
This Is The Win: Efficiency transforms "it felt like we were slammed" into "here's what happened, here's what we're changing, and here's how we prevent it next week."
Gap Time: The Profit Leak Almost Nobody Tracks
Gap time is the payroll cost hiding between jobs:
- Travel time to the next location
- Wait time before the next scheduled start
- Buffer time that looks harmless on a calendar but bleeds real dollars
The critical truth: You pay for gap time. Clients don't.
Even small gaps compound quickly. Here's the math:
| Gap Time | Team Size | Hourly Rate | Unproductive Cost |
|---|---|---|---|
| 2.0 hours | 2 cleaners | $18/hr | $72 |
| 1.5 hours | 3 cleaners | $18/hr | $81 |
| One Bad Routing Day | — | — | $70–$150+ |
That's direct cost. It doesn't account for lost capacity—additional jobs you could have booked if routing was tighter.
Over a month, gap time can easily cost $500–$1,500 in pure waste. Over a year, that's $6,000–$18,000 you paid for nothing.
Most cleaning business owners never calculate this because it's nearly impossible to track manually. Automated gap time tracking makes the invisible visible.
Cleaner Breakdown: Finding Winners And Coaching Opportunities
The cleaner breakdown is your film room. It shows you:
- Scheduled vs actual hours for each team member
- Regular hours vs overtime hours
- Gap time cost allocation
- Drive segments (expected travel time and distance between stops)
This is where you identify:
- Consistent performers: High efficiency, low gap costs, reliable execution
- Training opportunities: Repeated overruns on specific job types or property sizes
- Routing problems: Long drive segments that repeat week after week

The Best Part: You're not making judgments based on gut feeling. You're building a fair, data-backed story that helps you coach better, route smarter, price accurately, and protect margins systematically.
Your Weekly Profit Routine (5 Minutes That Save Hundreds)
Here's the simple habit that keeps margins healthy:
- Open Week Stats on Sunday evening or Monday morning
- If efficiency is below 95% or profit looks compressed, tap the worst-performing day
- In the day view, examine:
- Actual vs scheduled hours by job
- Overtime indicators
- Gap time totals and drive segments
- Cleaner-by-cleaner patterns
- Make one targeted adjustment:
- Update a pricing rule for a job type
- Refine an estimate category
- Adjust routing or scheduling logic
- Change team pairings for specific jobs
That's how raw numbers become better weeks, better months, and better years.
Frequently Asked Questions
What's the difference between estimated hours and actual hours?
Estimated hours come from your schedule and pricing assumptions. Actual hours come from timeclock data once the work is completed and logged.
Why would estimated profit look strong but actual profit look weak?
Usually one or more of these factors: jobs ran longer than estimated, overtime premiums kicked in, routing created excessive gap time, or the estimate didn't match the job's real condition or complexity.
What's a healthy efficiency percentage?
For most cleaning operations, 95–105% efficiency is a solid range. Consistently below 95% suggests you need to adjust pricing, refine estimates, improve coaching, or optimize routing.
Does low efficiency always mean cleaners are underperforming?
No. Low efficiency can indicate the job was underestimated, the property was in rougher condition than expected, or routing created time losses. Always drill down by day and by cleaner to find the real cause.
Why does gap time matter so much?
Because it's paid time that produces zero revenue. Tight routing and realistic buffer management protect margins immediately without requiring any change to your pricing.
How do drive segments help diagnose problems?
Drive segments show expected travel time and distance between job locations. If drive segments are consistently long, routing inefficiency—not cleaning speed—may be the root issue.
What should I do first when I see overtime on the report?
Check the day breakdown: was overtime caused by one job running long, or by accumulated small overruns plus excessive gap time throughout the week? Fix the root cause, not just the symptom.
Can this data improve my pricing strategy?
Yes. Efficiency percentages and actual profit margins over time reveal which job types, customer segments, or property conditions need different estimates, add-on fees, or premium pricing.
Ready To Stop Guessing About Profit?
If you're tired of wondering why revenue looks good but margins don't, it's time to see the three numbers that actually matter: efficiency, gap time, and actual profit.
Start your free trial of Gem City Cleaning Tools and get instant visibility into where your profit is going—before payroll hits and it's too late to fix it.
Start Free Trial →
Related Reading
- Why I Spent 2 Hours Every Sunday Scheduling Cleaners (And How I Fixed It) - The origin story behind building scheduling intelligence
- The Hidden Cost of "Just Using a Calendar" - The real price of manual workflow management
- 5 Scheduling Red Flags Every Cleaning Business Owner Misses - Warning signs that kill profit before you notice them