How to Know Which Cleaners Are Actually Profitable (Most Owners Get This Wrong)
I thought Sarah was my best employee until I saw the numbers: she cost me $8,400/year. Meanwhile, 'difficult' David generated $12,300 in profit. Here's how to track what actually matters.
Chris Wilson
I hired Sarah three years ago. Great cleaner. Customers loved her. I thought she was one of my best employees.
Then I actually looked at the numbers.
Sarah cost me $8,400 last year. Not because she was bad at cleaning—but because she consistently took 30-40% longer than estimated on every job. At her $18/hour pay rate, those extra hours ate all the profit.
Meanwhile, David—who I almost fired because a few customers complained—generated $12,300 in profit. He finished jobs fast, rarely called off, and his efficiency more than made up for the occasional complaint.
I had it completely backwards. And I only discovered this when I finally started tracking the right metrics.
Most cleaning business owners make decisions about employees based on feelings, not facts. Here's why that's costing you thousands—and how to fix it.
The Problem: You're Flying Blind on Employee Performance
When I ask cleaning business owners "which of your cleaners are actually profitable?", 9 out of 10 can't answer.
They know who customers like. They know who shows up on time. They know who causes problems.
But they don't know who makes them money.
Here's what most owners track (if anything):
- Number of jobs completed
- Customer complaints
- How often they show up
- General "vibe" of quality
Here's what they should track:
- Profit per employee (revenue minus labor cost)
- Efficiency (estimated time vs actual time)
- Profit margin (profit as percentage of revenue)
- Call-off frequency (reliability patterns)
- Performance trends (improving or declining?)
The gap between what you track and what matters is costing you money.
You're missing these employee performance problems for the same reason you might be missing scheduling red flags that cost you clients—you're not tracking the data that reveals patterns.
The 5 Red Flags You're Losing Money on Employees
Red Flag #1: You Don't Know Each Cleaner's Profit Margin
The scenario: Maria generates $15,000 in revenue per month. Sounds great! You give her raises, assign her the best jobs, tell everyone she's your star employee.
The reality: Maria takes 4 hours per job that's estimated at 2.5 hours. At $20/hour pay rate:
- Revenue per job: $150
- Labor cost per job: $80 (4 hours × $20)
- Profit per job: $70
- Profit margin: 46.7%
Meanwhile, Tom finishes the same jobs in 2 hours:
- Revenue per job: $150
- Labor cost per job: $40 (2 hours × $20)
- Profit per job: $110
- Profit margin: 73.3%
Tom is 57% more profitable than Maria, but you're rewarding Maria because she has higher revenue.
The Hidden Cost: If you have 5 cleaners and 3 of them have negative or low profit margins like Maria, you could be losing $15,000-30,000 annually without realizing it.
Red Flag #2: You Can't Identify Efficiency Problems Until It's Too Late
The scenario: You estimate jobs at 2 hours. You schedule the next job 2.5 hours later (with 30-minute buffer). Everything seems fine on paper.
The reality: Three of your cleaners consistently take 3+ hours. Now they're:
- Rushing to the next job (quality suffers)
- Showing up late (customers complain)
- Working unpaid overtime (resentment builds)
- Reducing your capacity (you could fit more jobs if they finished on time)
You don't notice because you're not tracking actual vs estimated time per cleaner.
What I discovered: When I finally tracked efficiency, I found:
- 2 cleaners averaged 85-95% efficiency (finishing on or ahead of schedule)
- 3 cleaners averaged 60-70% efficiency (taking 30-40% longer)
- 1 cleaner averaged 45% efficiency (taking more than twice as long)
The 45% efficiency cleaner? Negative profit margin. I was paying her more than clients were paying me.
Red Flag #3: Call-Off Patterns Are Invisible
The scenario: Jessica texts you Monday morning: "Not feeling well, can't make it today." You scramble to cover her jobs, reschedule some clients, and move on.
The pattern you're missing: Jessica calls off 2-3 times per month. That's 24-36 times per year. Each call-off costs you:
- 2-3 hours rescheduling and finding coverage
- Lost revenue from cancelled jobs
- Customer frustration (unreliability)
- Other cleaners' overtime to cover
In my operation, cost per call-off: ~$80 in admin time + lost revenue Annual cost (30 call-offs): $2,400
Your costs will vary based on your hourly rate for admin time, whether you can reschedule vs cancel, and overtime rates for coverage.
And you don't notice because you're not tracking frequency per employee.
Pattern Detection: When I started tracking call-offs per cleaner, I found one employee had 34 call-offs in 12 months (average: 2.8 per month). Letting her go saved $2,800/year in disruption costs alone.
Red Flag #4: You Can't See Performance Trends
The scenario: David was great for 18 months. Then something changed. Quality dropped. Speed slowed. Customers started complaining.
What you do: React to each complaint individually. "David had a bad day." "David's going through something." "It's just one job."
What you're missing: The trend started 4 months ago. His efficiency dropped from 90% to 65%. His average job duration increased by 45 minutes. His profit margin went from positive to break-even.
If you'd been tracking trends, you'd have spotted this in month 1 and addressed it before losing customers.
Red Flag #5: Hiring and Firing Decisions Are Based on Feelings
The scenario: You need to let someone go. Budget's tight. You have to choose.
How you decide:
- Maria is pleasant and customers like her
- Tom sometimes rubs clients the wrong way
- Jessica is reliable (you think)
How you should decide:
- Maria: 46% profit margin, 65% efficiency, 2 call-offs/month = $3,200 annual profit
- Tom: 73% profit margin, 95% efficiency, 0 call-offs = $18,600 annual profit
- Jessica: 31% profit margin, 58% efficiency, 2.8 call-offs/month = -$2,400 annual loss
You keep Maria because she's nice. You let Tom go because he's "difficult." You just traded an $18,600 winner for a $3,200 mediocre performer.
How to Track Employee Profitability (The Right Way)
When I finally decided to fix this, I tried three approaches:
Option 1: Spreadsheet Tracking
Pros: Free, familiar Cons: Takes 3-4 hours weekly to update, error-prone, no trend analysis
I tried this for 2 months. Too much manual work.
Option 2: Generic Time Tracking Software
Pros: Better than spreadsheets Cons: Doesn't calculate profit (only tracks hours), doesn't integrate with jobs, no cleaning-specific metrics
Tried this for 1 month. Got time data but still had to calculate profit manually.
Option 3: Integrated Employee Performance Dashboard
Pros: Automatic profit calculation, efficiency tracking, trend analysis, job integration Cons: Requires initial setup
This is what finally worked. Here's what I track now.
Quick Math: How to Calculate If Your Cleaners Are Profitable
Before diving into the metrics, here's the simple formula you need:
Step 1: Track Revenue Per Employee Sum all completed jobs for that cleaner in a month × price per job
Step 2: Calculate Direct Labor Cost Total hours worked (including drive time) × hourly pay rate
Step 3: Calculate Fully-Loaded Labor Cost Direct labor × (1 + burden rate) Burden includes payroll taxes, workers comp, unemployment insurance—typically 12-25%
Step 4: Calculate Gross Margin After Labor Revenue - Fully-Loaded Labor Cost = Gross Margin
Step 5: Calculate Labor Efficiency Ratio (Gross Margin / Revenue) × 100 = Labor Efficiency %
Real Example:
- Revenue generated: $12,000
- Hours worked: 160 hours (includes 15 hours drive time)
- Pay rate: $18/hour
- Direct labor cost: $2,880 (160 × $18)
- Fully-loaded labor cost: $3,168 ($2,880 × 1.10 assuming 10% burden)
- Gross margin after labor: $8,832 ($12,000 - $3,168)
- Labor efficiency: 73.6% ($8,832 / $12,000 × 100)
Important Distinctions:
- Labor efficiency (73.6%) = What's left after paying the cleaner (for comparing cleaners)
- Net profit margin = What you actually keep after all overhead (typically 10-28% industry-wide)
- This metric is for comparing cleaners apples-to-apples, not calculating your take-home profit
Interpretation for Labor Efficiency:
- 70%+ = Excellent (cleaner is fast and efficient)
- 60-70% = Good (profitable after direct labor)
- 50-60% = Acceptable (monitor for trends, check if overpaying or underpricing)
- Below 50% = Problem (losing money on direct labor alone)
Why most owners get this wrong: They track revenue ("Sarah brings in $15,000/month!") but ignore labor costs. Sarah might take 300 hours to generate that $15,000 (labor efficiency: 62%), while David generates $12,000 in 180 hours (labor efficiency: 74%). David is more efficient despite lower revenue.
Reality Check: Your net profit will be much lower after overhead (supplies, insurance, admin, marketing, software, vehicles). Industry net margins typically run 10-28%. This labor efficiency metric helps you compare cleaners, not calculate your business profit.
The Key Insight: Revenue without labor efficiency is a vanity metric. You can have high-revenue employees who generate low margins because they're slow, take long drive times, or are overpaid for their performance level.
The 5 Metrics That Actually Matter
Metric #1: Labor Efficiency Per Employee
What it is: Revenue generated minus fully-loaded labor cost (direct wages + burden)
Why it matters: Shows which cleaners contribute the most after labor costs (for comparing cleaners, not calculating business profit).
How to calculate:
Monthly Revenue Generated: $12,000
Hours Worked: 160 hours (including drive time)
Pay Rate: $18/hour
Direct Labor: $2,880 (160 × $18)
Fully-Loaded Labor: $3,168 ($2,880 × 1.10 burden)
Gross Margin After Labor: $8,832 ($12,000 - $3,168)
Labor Efficiency: 73.6% ($8,832 / $12,000)
What to look for:
- ✅ 70%+ labor efficiency = excellent
- ⚠️ 60-70% labor efficiency = acceptable
- ❌ Below 60% = problem
Important: Don't forget to include drive time in hours worked. A "fast" cleaner who drives 2 hours between jobs isn't actually efficient.
Metric #2: Efficiency Percentage (With Quality Controls)
What it is: Estimated job time divided by actual job time, paired with quality metrics
Why it matters: Speed alone can hide problems. A cleaner who finishes fast but generates complaints isn't actually efficient.
How to calculate:
Job Estimated: 2.5 hours
Actual Time: 3.5 hours
Efficiency: 71% (2.5 / 3.5 × 100)
Critical Guardrails:
-
Separate "estimate accuracy" from "cleaner speed"
- If ALL cleaners average 70% efficiency, your estimates are wrong—not the cleaners
- Track average efficiency across your whole team to spot pricing/estimating problems
-
Normalize by job type
- Deep cleans vs maintenance vs move-outs have different baseline times
- Don't compare a deep clean to a maintenance clean efficiency directly
-
Pair with quality counter-metrics
- Rework minutes per job
- Complaint rate per 100 jobs
- Refund/redo rate
What to look for:
- ✅ 90-110% efficiency + low complaints = truly efficient
- ⚠️ 70-90% efficiency + low complaints = acceptable but slower
- ❌ Below 70% = serious problem (underpricing or cleaner too slow)
- 🚨 High efficiency + high complaints = rushing, sacrificing quality
Metric #3: Average Gross Margin Per Job
What it is: Total gross margin after labor divided by number of completed jobs
Why it matters: Shows which cleaners generate the most value per job (useful for assigning high-value clients).
How to calculate:
Total Monthly Profit: $9,120
Jobs Completed: 48
Avg Profit Per Job: $190 ($9,120 / 48)
What to look for:
- Compare across cleaners to identify top performers
- Assign high-value jobs to high-profit cleaners
Metric #4: Call-Off Rate
What it is: Number of call-offs per month
Why it matters: Frequency reveals reliability. One cleaner with 3+ call-offs/month costs thousands in disruption.
What to look for:
- ✅ 0-1 call-off/month = reliable
- ⚠️ 2 call-offs/month = monitor
- ❌ 3+ call-offs/month = serious problem
Metric #5: Performance Trends
What it is: Month-over-month or quarter-over-quarter comparison
Why it matters: Spot declining performance early before customers leave or profit tanks.
What to track:
- Efficiency trend (improving or declining?)
- Profit margin trend
- Call-off frequency trend
What to look for:
- Declining efficiency = training issue or personal problem
- Declining profit margin = need to adjust pay rate or pricing
- Increasing call-offs = reliability becoming a problem
Why Significant Events Tracking Changes Everything
This is the metric most cleaning business owners ignore—and it costs them the most.
What is a significant event? Any incident that creates risk, cost, or customer dissatisfaction:
- Customer complaints (quality, behavior, professionalism)
- Property damage (broken items, scratches, stains)
- Safety incidents (injuries, accidents, unsafe practices)
- Policy violations (arriving late, leaving early, skipping tasks)
- Theft or missing items allegations
- Conflicts with customers or other employees
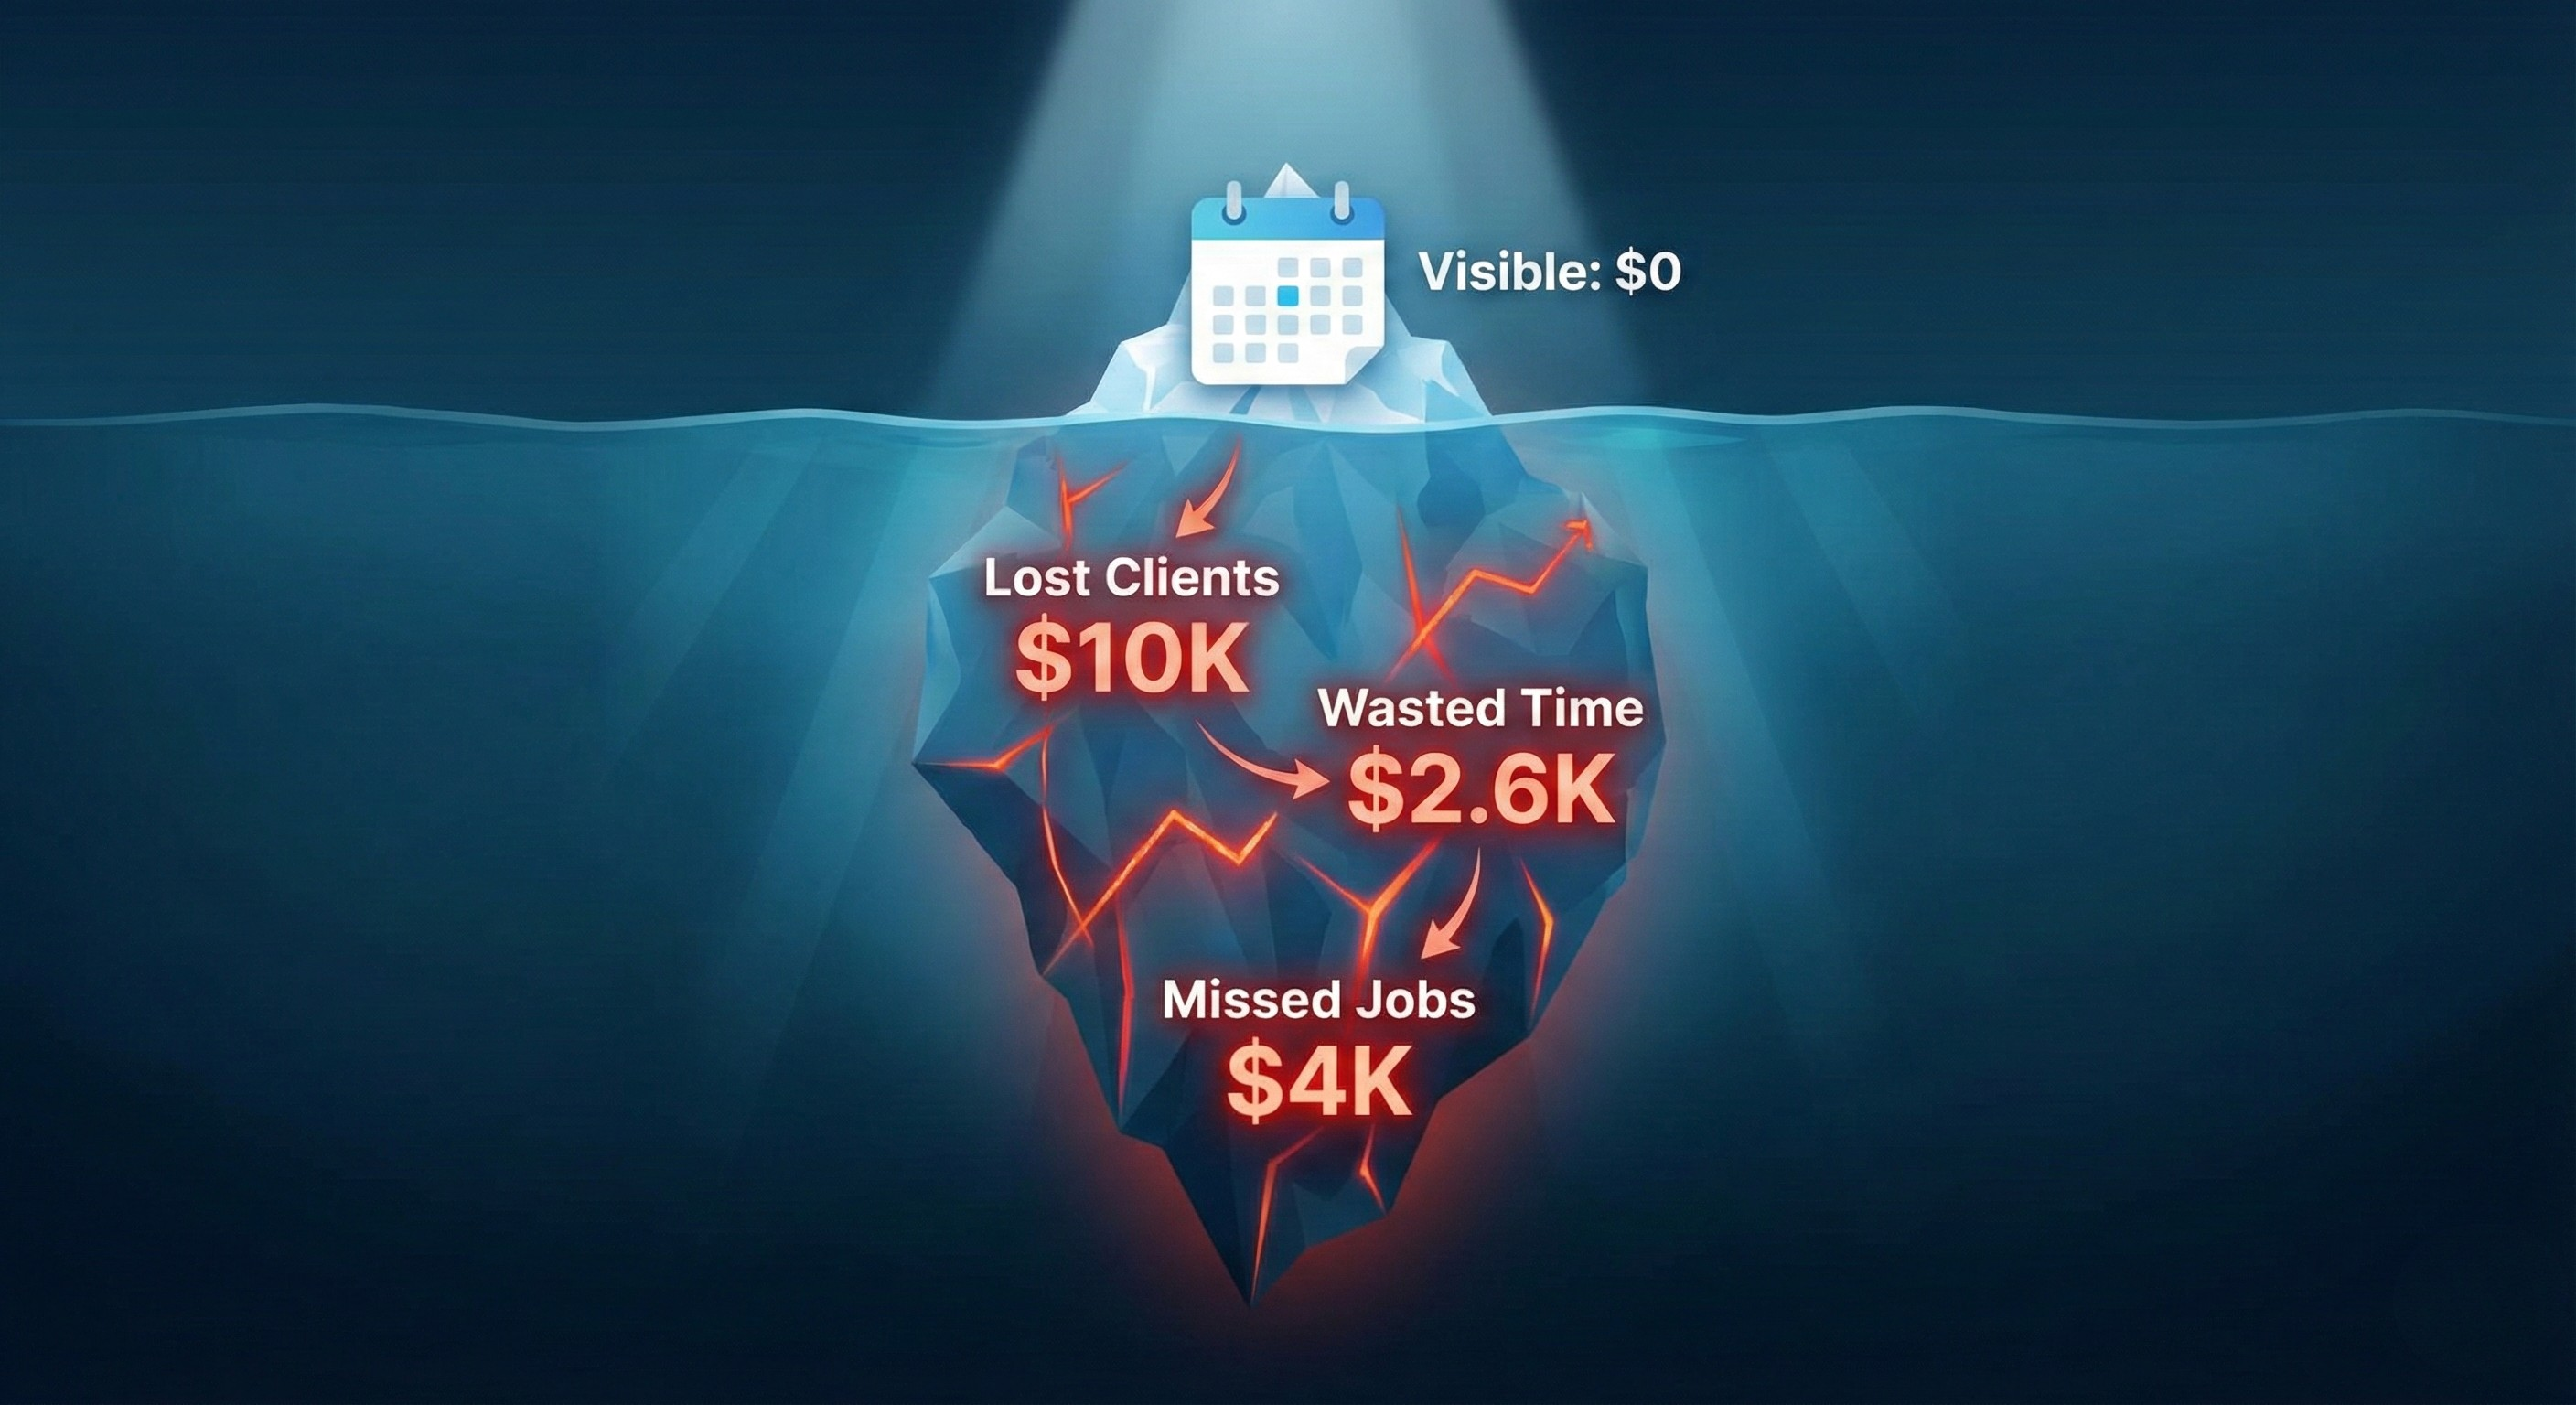
The Problem: Incidents Aren't Tracked
Before tracking significant events, here's what happened to me:
March 15: Mrs. Henderson calls: "Your cleaner broke my lamp." I apologize, replace the lamp ($85), move on.
May 3: Mr. Chen texts: "Cleaner left 30 minutes early." I talk to the cleaner, they say the job was done, I believe them.
July 22: Another customer: "Same cleaner damaged my countertop." I replace it ($240), starting to feel suspicious.
August 10: "Cleaner was rude to me." I have a conversation with them, they say the customer was difficult.
What I didn't see: All four incidents involved the same cleaner (Jennifer). I didn't connect the dots because I handled each incident individually, never tracking them per employee.
The pattern: Jennifer had 9 significant events in 6 months. Average across other cleaners: 0-1 event in 6 months.
Cost of not tracking:
- Property damage reimbursements: $580
- Lost customers (2 didn't renew): $3,600/year
- Time handling complaints: 8 hours
- Total: $4,180 + ongoing reputation damage
Once I started tracking, the pattern was obvious within 2 weeks.
The Hidden Pattern: 80% of significant events come from 20% of employees. If you're not tracking per employee, you can't identify problem patterns until it's too late.
How to Track Significant Events Properly
What to document for each event:
- Date and time of incident
- Employee(s) involved
- Type of event (complaint, damage, safety, policy violation)
- Severity (minor, moderate, severe)
- Description of what happened
- Customer name (if applicable)
- Cost/impact (financial loss, customer churn risk)
- Resolution (what was done to fix it)
- Follow-up action (training, warning, policy review)
Why this matters:
Pattern Detection: One complaint might be bad luck. Three complaints in two months is a pattern. Six in six months means you have a problem employee.
Objective Documentation: When you need to let someone go, you have specific, dated, documented incidents. "You've had 6 significant events in 4 months (see dates and details below)" is defensible. "You're just not working out" isn't.
Training Identification: If a cleaner has 3 incidents related to missing spots, they need training. If incidents are behavioral (rude to customers), that's a different problem requiring different action.
Insurance/Legal Protection: When a customer claims damage or files a complaint, having documented history protects you. "This cleaner has zero prior incidents in 18 months" vs "This cleaner has 8 prior complaints" changes everything.
Fair Performance Reviews: Don't rely on memory. "You've been great!" vs "Let's discuss these 4 documented incidents" is the difference between fact-based and feeling-based management.
The Significant Events Form I Use
Here's what my digital form captures (takes 2 minutes to fill out):
Basic Information:
- Incident date/time
- Cleaner(s) involved
- Job address/customer
- Severity level (1-5 scale)
Incident Details:
- Category: Complaint / Damage / Safety / Policy / Theft / Behavioral / Other
- What happened (brief description)
- Who reported it (customer, manager, employee, other)
- Was there a financial cost? If yes, amount
- Photos/evidence (if applicable)
Resolution & Follow-Up:
- Immediate action taken
- Long-term resolution
- Training needed?
- Policy update needed?
- Customer satisfied?
Employee Acknowledgment:
- Did employee acknowledge incident?
- Employee's explanation/perspective
- Corrective action plan
Example: How Significant Event Tracking Saved Me $12,000
The situation: David (remember him? My high-profit, "difficult" employee?) had 3 customer complaints in 5 months.
Without tracking, I would have: Let David go. He seemed problematic. Customers were complaining. Easy decision.
With tracking, I saw:
- Complaint #1: "David was short with me when I asked him to redo a spot." (Customer rating: 4 stars despite complaint)
- Complaint #2: "David didn't chat much, just worked." (Not actually a complaint, customer just noted he wasn't chatty. Rating: 5 stars)
- Complaint #3: "David left 15 minutes after start time." (Turned out customer had wrong time on their calendar, David was on time)
Pattern discovered: "Complaints" weren't actually problems. They were personality mismatches with clients who wanted a chatty cleaner. David's work quality was excellent (verified by ratings and lack of real issues).
Decision: Keep David, assign him to customers who value speed and quality over conversation. He never had another "complaint" after I matched him with the right clients.
Outcome: David generated $12,300 in profit that year. Without incident tracking, I would have lost him over fake problems.
Red Flags in Significant Events Data
🚨 Immediate concern (investigate now):
- 3+ incidents in 1 month
- Any severity-5 incident (major damage, safety violation, theft)
- Pattern of same type of incident (multiple damages, multiple complaints about same behavior)
⚠️ Monitor closely:
- 2 incidents in 1 month
- Increasing frequency (1 per quarter → 1 per month → 2 per month)
- Customer explicitly asks for different cleaner
✅ Normal/acceptable:
- 0-1 minor incident per quarter
- No pattern (different types of incidents, spread out over time)
- Incidents are resolved quickly and no recurrence
How This Changed My Hiring/Firing
Before significant events tracking:
- Made decisions based on "feeling" something was off
- Couldn't defend terminations with facts
- Kept problem employees too long because I didn't have documentation
- Lost good employees over isolated incidents (over-reacted without seeing full picture)
After significant events tracking:
- Every decision backed by documented data
- Can show an employee exactly why they're being let go (8 incidents in 6 months)
- Can defend good employees when customers complain (show this is the only incident in 12 months)
- Spot training needs early (3 incidents all related to the same skill gap)
The transformation: Went from reactive (handling each crisis individually) to proactive (spotting patterns before they become disasters).
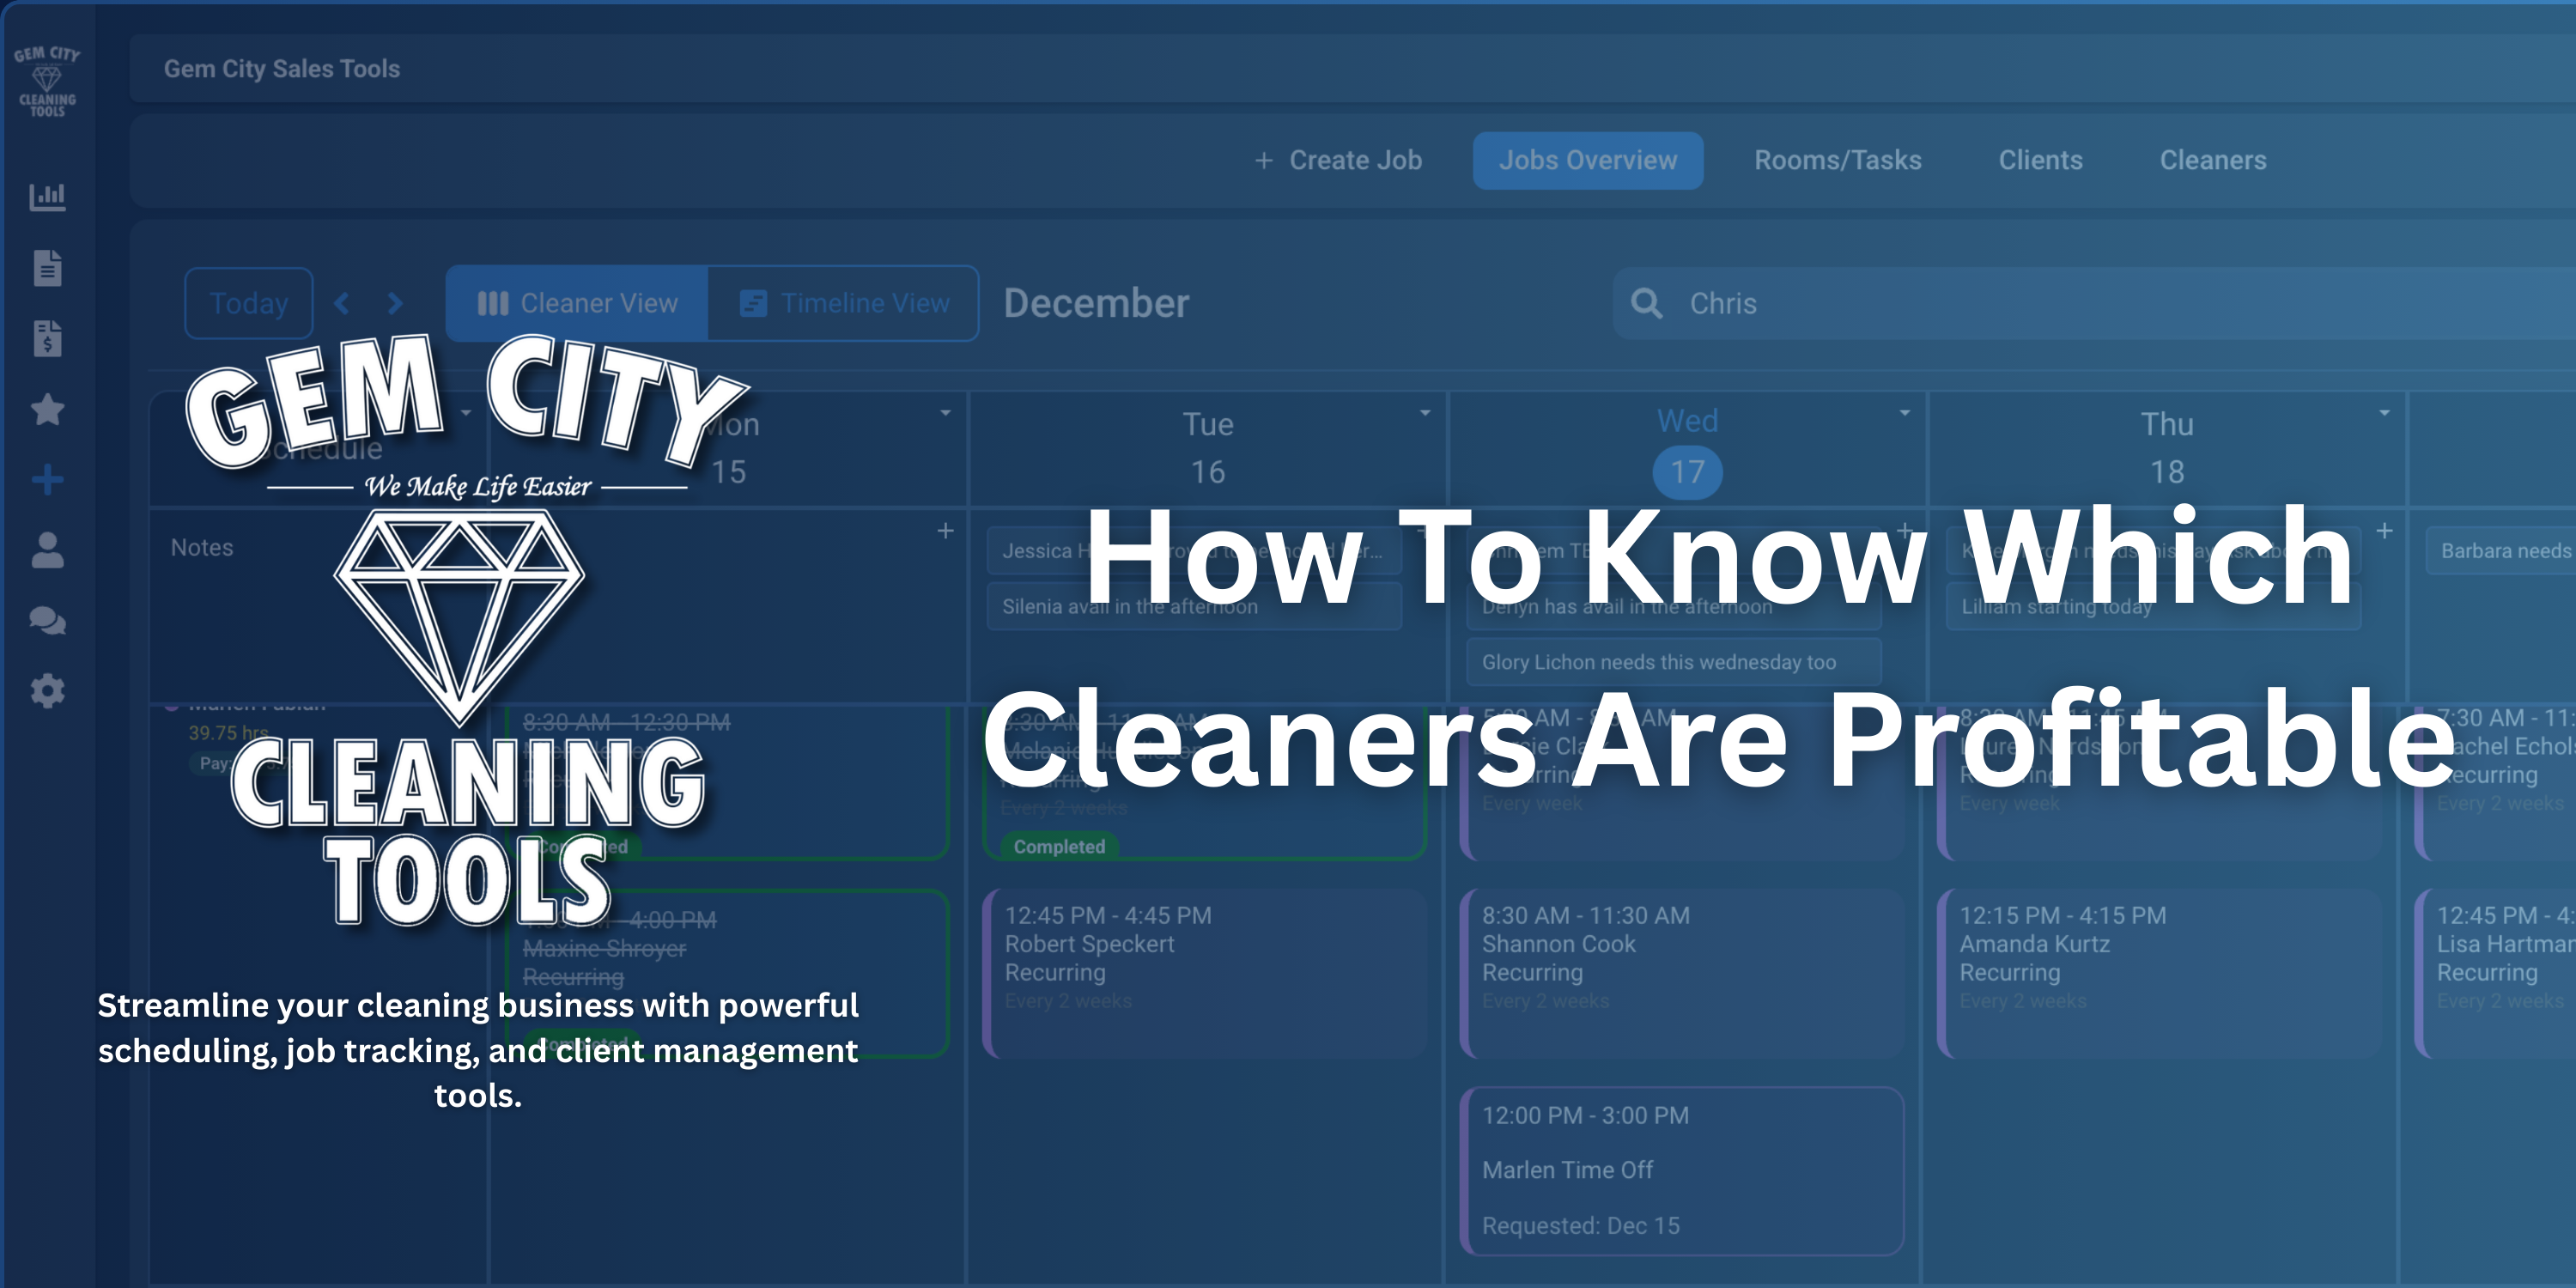
The Employee Performance Dashboard I Built
Here's what my dashboard shows for each cleaner:

Overview Card (At a Glance):
- Total jobs this month
- Total revenue generated
- Total profit generated
- Profit margin percentage
- Efficiency percentage
Detailed Metrics:
- Average profit per job
- Average duration per job
- Call-offs this period
- Significant events (complaints, damages, incidents)
- Client ratings
- Performance trend vs last period (+/- %)
Filterable Views:
- Month view
- Quarter view
- All-time view
Comparison Dashboard:
- Side-by-side cards for all cleaners
- Sortable by any metric (profit, efficiency, revenue)
- Visual indicators (green = good, red = problem)
How This Changed My Hiring and Management
Discovery #1: My "Problem" Employee Was My Most Profitable
David got occasional complaints about being "gruff." I almost let him go.
The data showed:
- 95% efficiency (almost always finished on time)
- 78% profit margin (highest on my team)
- 0 call-offs in 12 months
- $18,600 annual profit
Decision: Kept David, assigned him to clients who value speed over chatty service.
Discovery #2: My "Star" Employee Was Losing Me Money
Sarah was beloved by customers. Always cheerful. Never complained.
The data showed:
- 62% efficiency (took 38% longer than estimated)
- 41% profit margin (below acceptable)
- $3,400 annual profit (should have been $12,000+)
Decision: Trained Sarah on time management, adjusted her job assignments to better fit her pace, eventually moved her to part-time. Her profitability improved to 58% margin.
Discovery #3: One Cleaner's Call-Offs Cost $2,800/Year
Jessica seemed reliable because she never complained and did good work when she showed up.
The data showed:
- 34 call-offs in 12 months (2.8/month average)
- Each call-off cost ~$80 in disruption (2 hours rescheduling + lost revenue)
- Annual cost: $2,720
Decision: Documented pattern, had honest conversation, set expectations. Call-offs dropped to 1/month. Saved $2,000+/year.
Implementation: How to Set This Up
Step 1: Start Tracking Time (If You're Not Already)
Use GPS clock-in/clock-out for all jobs. This gives you:
- Actual start time
- Actual end time
- Actual duration
- Location verification
Don't skip this. Without accurate time tracking, you can't calculate profit or efficiency.
Step 2: Record Estimated Time for Each Job
When scheduling, estimate how long the job should take. This creates the baseline for efficiency tracking.
How to estimate:
- Use historical data if you have it
- Otherwise, estimate conservatively and adjust as you learn
Step 3: Track Call-Offs Per Employee
Every time someone calls off, log it with:
- Date
- Employee name
- Reason (optional, but helps identify patterns)
You'll start seeing patterns within 1-2 months.
Step 4: Calculate Profit Monthly
For each employee, calculate:
Revenue Generated - (Hours Worked × Pay Rate) = Profit
Profit / Revenue Generated = Profit Margin %
Do this monthly. Takes 20-30 minutes manually in a spreadsheet.
Or: Use software that calculates automatically from time clock data.
Step 5: Review and Act on the Data
Monthly review:
- Which cleaners have profit margins below 50%?
- Which cleaners have efficiency below 70%?
- Which cleaners have 2+ call-offs this month?
Quarterly review:
- Are any trends emerging? (Declining performance, increasing call-offs)
- Should pay rates be adjusted based on profitability?
- Should job assignments change based on efficiency data?
The Time & Money Math
Before Tracking Performance
Time spent:
- Manually tracking hours in spreadsheets: 2 hours/week
- Guessing at profitability: infinite (never knew the answer)
- Making decisions based on feelings: high risk
Money lost:
- 1-2 underperforming cleaners: $5,000-15,000/year
- Call-off disruptions: $2,000-3,000/year
- Wrong hiring/firing decisions: $10,000+/year
- Total: $17,000-30,000/year
After Automated Performance Tracking
Time spent:
- Reviewing dashboard: 15 minutes/week
- Monthly deep dive: 30 minutes/month
Money saved/gained:
- Identified underperformers: $8,000/year saved
- Reduced call-off disruptions: $2,000/year saved
- Better job assignments (best cleaners to best jobs): $5,000+/year gained
- Data-driven pay decisions: $3,000/year saved (not over-paying)
- Total: $18,000+/year impact
ROI: Even if tracking only saves you $10,000/year, that's worth 10-20 hours of setup time and ~$50-100/month in software costs. The payback period is under 1 month.
Common Questions About Employee Performance Tracking
"Won't employees hate being tracked?"
Good employees love being tracked because it proves they're valuable. Bad employees hate it because they can't hide anymore.
How I framed it: "We're implementing performance tracking so I can reward top performers fairly. Your efficiency, profit generation, and reliability will determine raises and bonuses."
Top performers got raises. Underperformers either improved or left. Win-win.
"What if employees game the system?"
Concern: Cleaners rush jobs to boost efficiency, sacrificing quality.
Solution: Track quality metrics too (client ratings, rework requests). A cleaner with 95% efficiency but 3-star ratings isn't actually efficient.
The dashboard should show:
- Efficiency
- Client ratings
- Significant events (complaints, damages)
"This seems like a lot of work to set up."
If you do it manually: Yes, 10-20 hours initially.
If you use integrated software: 1-2 hours to configure, then automatic calculations from time clock data.
I spent 3 hours setting up the automated version. It's saved me 100+ hours in the 12 months since.
"How do I handle low performers?"
Step 1: Show them the data. "Your efficiency is 58%, which means jobs are taking 40% longer than estimated."
Step 2: Set expectations. "We need to see this improve to 75%+ within 60 days."
Step 3: Provide training or adjust assignments. Maybe they're better at different job types.
Step 4: If no improvement, part ways. You have data to support the decision.
The data makes difficult conversations easier. It's not personal—it's math.
"What about new employees?"
Give them a grace period. New cleaners need 30-60 days to get up to speed.
After 60 days: They should be hitting 70%+ efficiency and positive profit margins. If not, they're not going to improve.
What Changed for Me
I used to dread the thought of letting someone go or giving difficult feedback. It felt personal. I'd avoid it for months.
Now? The data tells me exactly what's happening. No guessing. No feelings. Just facts.
Example conversation:
- "Your profit margin this quarter was 42%, which is below our 50% minimum."
- "Your efficiency was 64%, meaning jobs are taking 36% longer than estimated."
- "This is costing the business about $600/month."
- "Here's what needs to improve: finish jobs within 10% of estimated time, which will bring your profit margin up to 58%+."
Employee can't argue with math. They either improve or they don't.
And the good employees? They love it.
David got a raise because the data showed he was generating 2x the profit of other cleaners. Sarah asked for training to improve her efficiency. Jessica reduced her call-offs because she knew I was tracking.
Performance tracking doesn't just identify problems—it rewards excellence.
The Bottom Line
You can't manage what you don't measure.
If you don't know which cleaners are profitable, which are efficient, and which are reliable—you're managing based on feelings, not facts.
And feelings cost money.
The five metrics that matter:
- Profit per employee (revenue - labor cost)
- Efficiency (estimated time / actual time)
- Average profit per job
- Call-off frequency
- Performance trends (month-over-month)
Start tracking these, and you'll discover what I did: some of your "best" employees are costing you money, and some of your "problem" employees are your most profitable.
Want to See It In Action? I'll show you exactly how our employee performance dashboard works—profit calculations, efficiency tracking, trend analysis, and side-by-side comparisons. Real data from real cleaning businesses.
Frequently Asked Questions
How do I calculate profit per employee in a cleaning business?
Calculate profit per employee by subtracting labor costs from revenue generated. Labor cost = hours worked × pay rate. Example: $12,000 revenue - (160 hours × $18/hour = $2,880) = $9,120 profit. Divide by revenue for profit margin: $9,120/$12,000 = 76% profit margin.
What is a good profit margin for cleaning employees?
A good profit margin for cleaning employees is 65% or higher. Acceptable is 50-65%. Below 50% indicates either underpric ing, inefficiency, or overpaying. Top performers achieve 70-80% profit margins through high efficiency and reliability.
How do I track employee efficiency in a cleaning business?
Track employee efficiency by comparing estimated job time to actual time using GPS clock-in/clock-out. Calculate: (Estimated Time / Actual Time) × 100. Example: 2.5 hour estimate / 3.5 actual hours = 71% efficiency. Target 90-110% for optimal performance.
What should I do about underperforming employees?
Address underperforming employees with data: show them specific metrics (efficiency percentage, profit margin, call-off frequency). Set clear improvement targets with 60-day timeline. Provide training or adjust job assignments. If no improvement after 60 days, part ways using performance data to support the decision.
How often should I review employee performance metrics?
Review employee performance metrics monthly for basic tracking (profit, efficiency, call-offs) taking 15-20 minutes. Conduct quarterly deep reviews (30-60 minutes) to analyze trends, adjust pay rates, and optimize job assignments. Annual reviews inform hiring/retention decisions.
Can employee performance tracking improve retention?
Yes. Performance tracking improves retention of top performers by rewarding them with data-driven raises and recognition. It also accelerates turnover of poor performers who either improve quickly or leave. The result: higher-quality team, less drama, better profitability.
What employee metrics matter most for cleaning businesses?
The five most important metrics: (1) Profit margin (revenue - labor cost), (2) Efficiency (estimated vs actual time), (3) Call-off frequency (reliability), (4) Client ratings (quality), (5) Performance trends (improving or declining). These reveal profitability, reliability, and quality.
How do I track call-offs per employee?
Track call-offs by logging each occurrence with date, employee name, and reason. Calculate monthly frequency per employee. Set thresholds: 0-1 per month = reliable, 2 per month = monitor closely, 3+ per month = serious problem costing $50-100 per call-off in disruption costs.
Should I share performance metrics with employees?
Yes, share performance metrics transparently. Top performers appreciate recognition backed by data. Underperformers need specific numbers to understand expectations. Frame it positively: "We track performance to reward excellence fairly." Use metrics for raises, bonuses, and job assignments.
What's the best employee performance tracking software for cleaning businesses?
Look for software that integrates GPS time tracking with job management and automatically calculates profit (revenue - labor cost). Essential features: efficiency tracking, call-off logging, trend analysis, comparison dashboards, and exportable reports. Free trials let you test with your actual data.
About the Author: Chris Wilson runs Gem City Cleaning Crew and built Gem City Cleaning Tools after discovering his "best" employee was costing him $8,400/year while his "problem" employee generated $12,300 in profit. Performance tracking with real data changed everything—and now he makes hiring and pay decisions based on facts, not feelings.