7 KPI Reports Every Cleaning Business Should Track
The 7 essential KPI reports cleaning businesses need: efficiency, revenue, profitability, jobs, team performance, customer health, and accounts receivable.
Chris Wilson
7 KPI Reports Every Cleaning Business Should Track
Most cleaning business owners check two numbers: revenue and payroll. If revenue is up, things feel good. If payroll is down, even better.
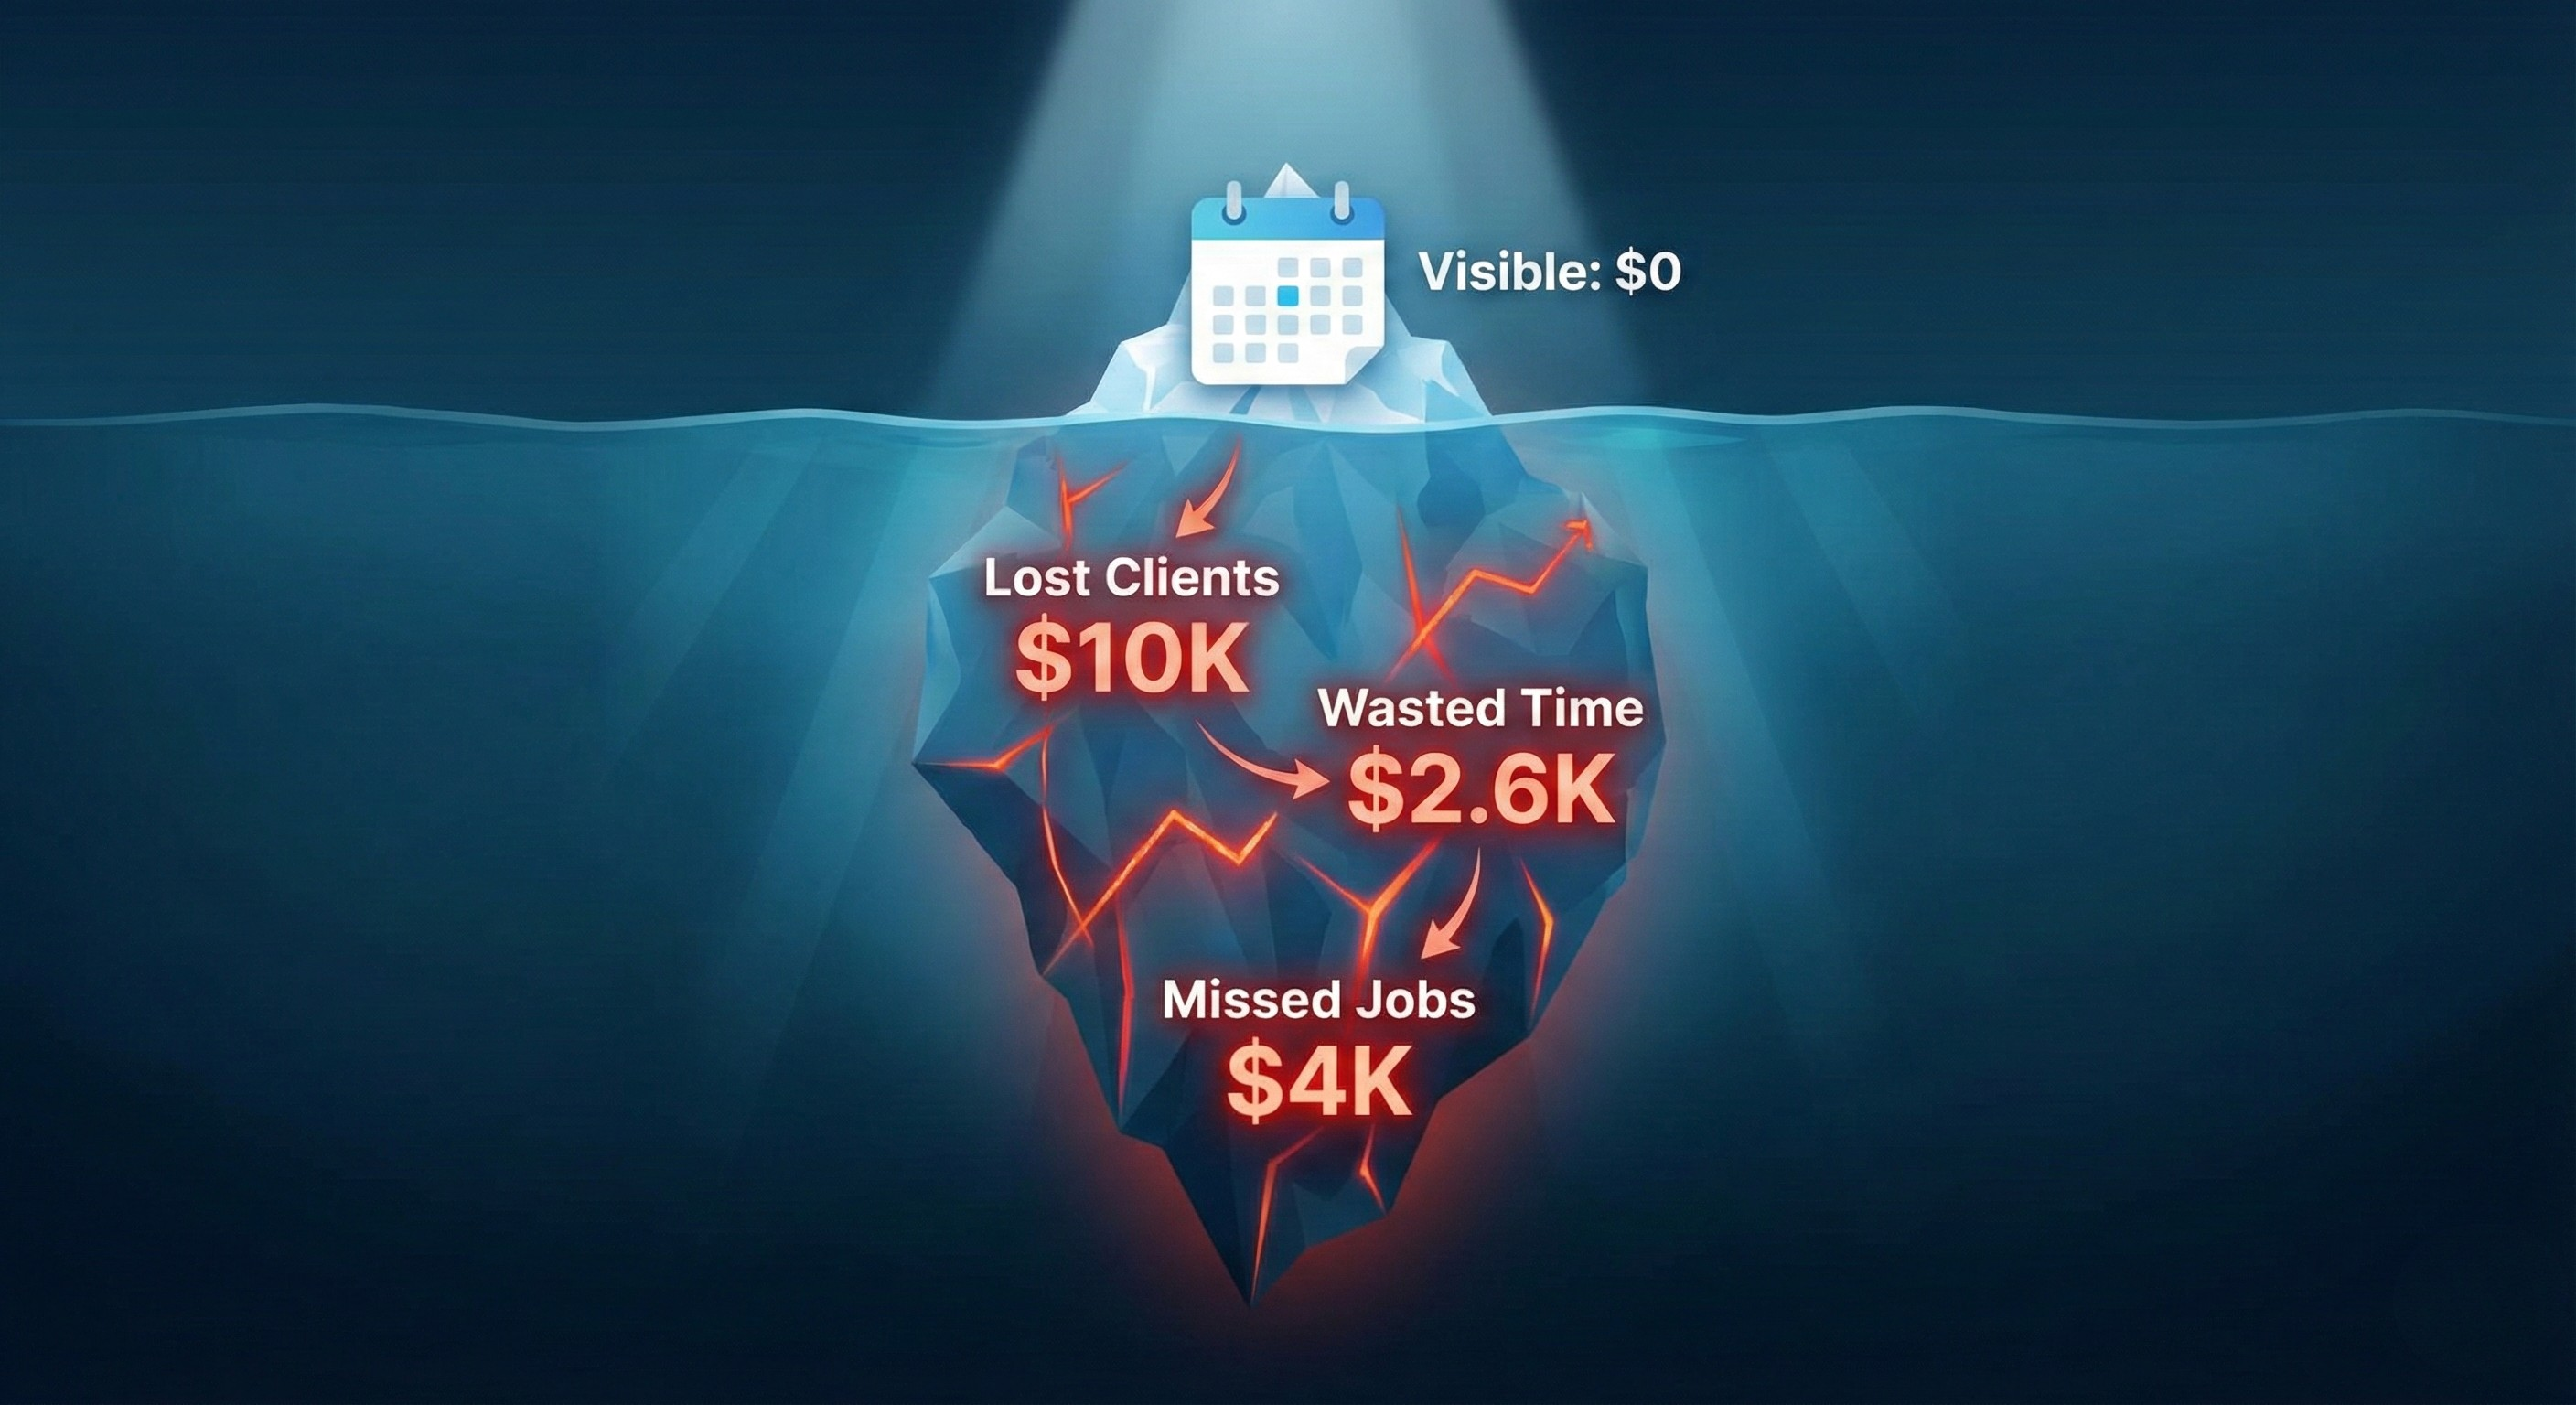
But those two numbers alone hide more than they reveal. A business pulling $40,000/month in revenue can be bleeding money through inefficiency, churn, and uncollected invoices—and the owner won't know until the bank account tells a different story.
KPI reports exist to close that gap. They turn raw operational data into answers: Which cleaners are profitable? Are jobs priced correctly? Is customer churn accelerating? How much revenue is sitting in unpaid invoices?
This guide breaks down the 7 essential KPI reports that cleaning businesses need, what each one measures, and the specific benchmarks that separate healthy operations from ones slowly losing money.
Quick Reference: The 7 reports covered here are Efficiency & Operations, Revenue, Profitability, Jobs Overview, Team Performance, Customer Health, and Invoices & Accounts Receivable. Each report targets a different layer of business health.
Why Revenue Alone Is a Terrible Metric
Revenue measures activity, not health. A cleaning business can increase revenue by 20% while profit drops—if labor costs, cancellations, or inefficiency grow faster than income.
Consider this scenario: a company completes 200 jobs per month at $150 average, generating $30,000 in revenue. But cleaners consistently take 30% longer than estimated, driving payroll costs up. The churn rate creeps to 7%, meaning the business replaces 7 customers per month just to stay flat. And 15% of invoices sit unpaid past 60 days.
On paper, revenue looks fine. In reality, the business is deteriorating across three dimensions simultaneously.
KPI reports catch these problems because they measure ratios and rates, not just totals. A ratio like revenue-per-labor-hour or a rate like churn percentage tells you whether the underlying operation is getting better or worse—regardless of what revenue does.
Report 1: Efficiency & Operations

This is the operational heartbeat of the business. It answers one question: are jobs being completed on time and within budget?
Key Metrics
- Efficiency Rating (target: 95%+): Compares scheduled hours to actual hours. If a job is estimated at 3 hours and the team finishes in 2.75 hours, that's above 100% efficiency. If it takes 3.5 hours, efficiency drops below 90%.
- Utilization Rate (target: 80%): Measures what percentage of available team hours are spent on billable work. A utilization rate of 65% means 35% of paid time goes to drive time, breaks, admin, and gaps between jobs.
- Completion Rate: Percentage of scheduled jobs that were actually completed versus cancelled. A dropping completion rate signals scheduling or reliability problems.
- On-Time Rate: Percentage of jobs where the team arrived on schedule. Late arrivals correlate directly with customer complaints and eventual churn.
What to Watch For
An efficiency rating below 85% means jobs are consistently underestimated or teams are underperforming. Either way, labor cost per job is higher than planned, and margins erode.
Low utilization (below 75%) often points to poor geographic routing. Cleaners spend too much time driving between jobs instead of cleaning. Tightening routes or clustering jobs by neighborhood can push utilization above 80%.
Benchmark: Late arrivals above 10% of total jobs should trigger immediate investigation. Late arrivals are one of the strongest predictors of customer cancellations.
If you're already tracking scheduling red flags, the efficiency report quantifies exactly how much those red flags cost in hours and dollars.
Report 2: Revenue

The revenue report goes beyond the top-line number to show how revenue is generated and whether it's trending in the right direction.
Key Metrics
- Total Revenue: Income from completed jobs in the selected period.
- Revenue Per Job: Average revenue per completed job. This number reveals pricing health—if it's declining, jobs may be underpriced or the mix is shifting toward lower-value work.
- Revenue Per Hour: Revenue generated per payroll hour. This is one of the most important metrics in any service business because it directly connects income to labor capacity.
- Average Bill Rate: The base billing rate per service, showing what the market is actually paying.
What to Watch For
Revenue per hour is the single most actionable revenue metric. If total revenue grows but revenue per hour stays flat (or drops), the business is simply working more hours for the same return. That's a treadmill, not growth.
Tracking revenue trends over time—week over week or month over month—reveals seasonality and growth patterns. A comparison against the previous period immediately shows whether things are improving or declining.
Report 3: Profitability

Revenue is vanity; profit is sanity. The profitability report strips away the top-line number to show what the business actually keeps.
Key Metrics
- Payroll-to-Revenue Ratio (benchmark: 30-40%): The percentage of revenue spent on payroll. This is the single most important profitability metric for labor-intensive businesses like cleaning. Below 30% is excellent. Above 40% signals a pricing or efficiency problem.
- Gross Profit & Margin: Revenue minus direct costs (labor, supplies). Shows profitability before overhead.
- Net Profit & Margin: Revenue minus all expenses. Shows true bottom-line profitability.
- Expense Breakdown: Categories like payroll, supplies, equipment, vehicle costs, and overhead—visualized to show where money goes.
What to Watch For
The payroll-to-revenue ratio is the metric to obsess over. The industry benchmark of 35% means that for every $100 in revenue, $35 goes to labor. If this ratio creeps above 40%, the business is either underpricing jobs, overstaffing, or dealing with efficiency problems.
An expense breakdown that shows payroll consuming 50%+ of revenue is a red flag that should prompt immediate review of job pricing, team efficiency, and scheduling density.
For a deeper dive into the math behind profit margins, see the complete guide to calculating cleaning business profit.
Report 4: Jobs Overview

The jobs report provides a 360-degree view of job volume, mix, and profitability by breaking down performance across job types and service frequencies.
Key Metrics
- Total Jobs & Revenue: Volume and income from completed work.
- Profit Margin %: Profit as a percentage of revenue across all jobs.
- Revenue Per Labor Hour: How much each hour of labor generates in revenue.
- Average Team Size: Number of cleaners per job—affects both capacity and cost.
- Cancellation Rate: Percentage of jobs cancelled versus completed.
Breakdown by Job Type
Not all jobs are equally profitable. A residential deep clean might generate $250 in revenue but require 4 labor hours. A recurring bi-weekly clean might generate $150 but only require 1.5 hours.
Breaking down revenue per labor hour and profit margin by job type (residential, commercial, deep clean, move-in/out) reveals which services actually make money and which ones are subsidized by more profitable work.
Breakdown by Service Frequency
Recurring customers are the backbone of a cleaning business, but not all frequencies perform equally:
- Weekly clients tend to have shorter job times (homes stay cleaner between visits) and higher revenue per labor hour.
- Bi-weekly clients are the most common frequency and typically represent the core revenue base.
- Monthly and one-time clients often require more labor per visit and carry higher cancellation risk.
Tracking profit margin by frequency helps prioritize which types of recurring work to pursue and which to price more aggressively.
Report 5: Team Performance

This report answers the question every cleaning business owner eventually asks: which employees are actually making the business money?
Key Metrics (Per Cleaner)
- Jobs Completed: Volume of work per team member.
- Total Revenue Generated: Revenue attributed to each cleaner.
- Efficiency %: How actual job time compares to estimated time. A cleaner at 95% efficiency finishes jobs close to estimates. A cleaner at 65% consistently runs over.
- Utilization %: Percentage of paid hours spent on billable work.
- Payroll Hours & Total Pay: What each cleaner costs.
- Late Arrivals: Frequency of tardy arrivals per cleaner.
- Overtime Hours: Overtime directly increases labor cost per hour (typically 1.5x).
What to Watch For
The gap between your most and least efficient cleaners is usually larger than expected. It's common to find a 30-40 percentage point spread—some cleaners at 95% efficiency, others at 55%.
A cleaner with low efficiency and high overtime is a compounding cost problem: they take longer on every job (reducing margins) and the extra hours push them into overtime territory (increasing cost per hour).
Key Insight: Team performance data should drive coaching, not just evaluations. A cleaner trending from 85% to 70% efficiency over three months needs intervention before they become a profitability problem.
For a detailed breakdown of how to evaluate cleaner profitability, see how to know which cleaners are actually profitable.
Report 6: Customer Health

Customer acquisition costs 5-7x more than retention. The customer health report tracks churn, lifetime value, and the reasons customers leave.
Key Metrics
- Churn Rate (benchmark: ~5%): Percentage of recurring customers lost in a period. Below 3% is excellent. Above 7% is critical—the business is losing customers faster than it can sustainably replace them.
- New Customers: Count of customers acquired in the period.
- Lifetime Value (LTV): Average total revenue per customer over the relationship. Higher LTV means each customer is worth more, which justifies higher acquisition costs.
- Recurring Revenue Lost: Dollar value of lost recurring services—quantifies the real financial impact of churn.
Customer Mix
A healthy cleaning business tracks the composition of its customer base:
- Recurring customers (target: 70%+ of base) provide predictable revenue and scheduling.
- One-time customers are valuable for revenue spikes but don't build the base.
- Former customers represent lost revenue—understanding why they left prevents further churn.
Cancellation Reasons
Tracking why customers leave reveals patterns that can be fixed. Common cancellation reasons include:
- Financial changes — External, hard to prevent
- Quality dissatisfaction — Actionable: training, quality checks
- Schedule conflicts — Actionable: flexible scheduling
- Switching providers — Actionable: competitive pricing review
- Moving — External, but an opportunity for referrals
If "quality dissatisfaction" or "schedule conflicts" represent more than 20% of cancellations, those are operational problems with operational solutions.
Top and Bottom Customers
Not all customers are equally valuable. Identifying the top 5 customers by profitability shows who to protect at all costs. Identifying the bottom 5 shows which accounts might actually be losing money—and may need a price increase or service restructuring.
Report 7: Invoices & Accounts Receivable

Revenue on paper means nothing if it's sitting in unpaid invoices. The A/R report tracks collection performance and aging receivables.
Key Metrics
- Total Outstanding (A/R): Total unpaid invoices across all customers.
- Days Sales Outstanding (DSO): Average number of days to collect payment. Lower is better—DSO above 45 days signals collection problems.
- Collection Rate: Percentage of invoices successfully collected.
- Average Days to Pay: How long customers typically take to pay.
- Overdue Rate: Percentage of invoices past their due date.
A/R Aging Buckets
Outstanding invoices are categorized by age to prioritize collection efforts:
| Aging Bucket | Status | Action |
|---|---|---|
| 0-30 days (Current) | Normal | Monitor |
| 31-60 days | Warning | Send reminder |
| 61-90 days | Urgent | Direct outreach |
| 90+ days | Critical | Collection action or write-off |
Any invoice that reaches 90+ days has a significantly reduced chance of collection. Catching overdue invoices at the 31-60 day mark is where effective A/R management happens.
Cash Flow Warning: A business with $40,000 in monthly revenue but $12,000 in outstanding A/R (30% of revenue) has a cash flow problem, even if it's technically profitable. Monitor DSO weekly, not monthly.
Top Customers by Outstanding Balance
Identifying which customers carry the largest unpaid balances focuses collection efforts where they'll have the most impact. Often, 20% of customers account for 80% of outstanding A/R.
How These Reports Work Together
No single report tells the full story. The power comes from reading them together:
- Efficiency + Revenue: High efficiency but flat revenue? Jobs might be priced too low. Low efficiency but strong revenue? Margins are being eroded by labor overruns.
- Profitability + Team Performance: If profit margins are declining, the team performance report reveals whether it's an efficiency problem (some cleaners running long) or a cost problem (overtime, new hires at higher rates).
- Customer Health + Jobs Overview: Rising churn and declining job volume together signal a retention crisis. Rising churn with stable volume means acquisition is keeping pace—but at what cost?
- Revenue + A/R: Strong revenue with growing A/R means the business is generating work but not collecting payment. This eventually becomes a cash flow crisis.
The Weekly Review Habit
The most effective cleaning business operators spend 15-20 minutes per week reviewing KPIs. A practical cadence:
- Daily: Glance at efficiency and on-time rates for today's jobs
- Weekly: Review revenue, profitability, and team performance for the week
- Monthly: Deep dive into customer health, churn trends, and A/R aging
- Quarterly: Compare all metrics against previous quarter to identify trends
Benchmarks Quick Reference
| KPI | Healthy | Warning | Critical |
|---|---|---|---|
| Efficiency Rating | 95%+ | 85-94% | Below 75% |
| Utilization Rate | 80%+ | 70-79% | Below 65% |
| Payroll-to-Revenue | Below 30% | 30-40% | Above 40% |
| Churn Rate | Below 3% | 3-5% | Above 7% |
| DSO (Days Sales Outstanding) | Below 30 days | 30-45 days | Above 45 days |
| Collection Rate | 95%+ | 90-95% | Below 90% |
| On-Time Rate | 95%+ | 90-95% | Below 85% |
| Late Arrivals | Below 5% | 5-10% | Above 10% |
The Bottom Line
Running a cleaning business without KPI reports is like driving at night without headlights. Revenue tells you how fast you're going. KPIs tell you whether you're on the road.
The seven reports covered here—efficiency, revenue, profitability, jobs, team performance, customer health, and accounts receivable—cover every layer of business health from daily operations to long-term financial sustainability.
The cleaning businesses that consistently grow aren't the ones that work hardest. They're the ones that measure what matters and act on what the numbers reveal.
Start with the metric that feels most urgent for your business right now. For most owners, that's either the payroll-to-revenue ratio (profitability) or the efficiency rating (operations). Get one report dialed in, then expand from there.